10月22日与25日之间的跳空缺口有中继缺口的意义吗?
同时转帖一份国外的材料,为楼主作一参考。
EURUSD (1.2969)
by J.P. Chorek
11/16/2004, Forexnews.com
EURUSD (1.2969): As long as 1.2913/03 holds, the next big move should be higher.
Key points:
1. Short-term trend—bullish (dynalibrium up, moving average crossovers bullish, and trendlines/channel lines bullish).
2. Minute-term rhythm—topping (hourly momentum indicators down around neutral, 1-week cycle bust).
3. Micro-term structure—sideways correction.
4. Resistance: 1.2999/1.3005, 1.3125, 1.3156, 1.3353.
5. Support: 1.2913/03, 1.2872/54, 1.2854/43, 1.2757, 1.2738, 1.2654/05.
Insights/Observations: It seems that when rhythm conditions stand in contrast to the underlying short-term bull trend, all we see is choppy, sideways action. That's a testament to the strength of the trend, as it's able to hold on to previous gains during downward cycles and bad momentum periods.
Such has been the case since yesterday for this pair. Hourly indicators have come down from positive territory to the neutral zone, while the 1-week cycle has rolled over into its bust phase. Yet prices have only swung back and forth in a seemingly tightening range.
These swings are taking on the appearance of a triangle pattern. Rather than go through all the gory Elliott wave details of such a formation, suffice it to say that as long as the 1.2913 (low from yesterday) to 1.2903 (.618 of 1.2843-1.2999) support zone holds, the bull trend should resume sooner rather than later.
A move above the 1.2999/1.3005 triangle high would bring focus to these ongoing targets:
1.3125 ((5)=(1) .8225-.9594 rally when added to 1.1756 wave (4) low-point),
1.3156 ((5)=widest part of wave (4)), and
1.3353 ((5)=(1) .8225-.9594 rally when added to 1.1984 wave (4) terminus).
Micro-term support is around 1.2941 (.618 since 1.2913), but only a break of 1.2913/03 would bring back the case for a downswing to 1.2843 within the wave (iv) structure from 1.3005. |

 爆仓熔断,风险管控,避免雪崩烧“屋”611 人气#黄金外汇论坛
 黄金五限策略591 人气#黄金外汇论坛
 MT5精确控制图表显示:如何一屏固定显示1001526 人气#黄金外汇论坛
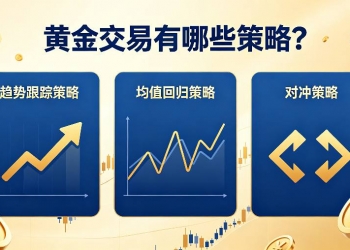 黄金交易有哪些策略?2026年多空拉锯下的实1548 人气#黄金外汇论坛


 提升卡
提升卡 置顶卡
置顶卡 沉默卡
沉默卡 喧嚣卡
喧嚣卡 变色卡
变色卡 显身卡
显身卡

 微信微信
微信微信 官方微博
官方微博